Tag: Bitcoin news

  • The Saylor Discount: Why Bitcoin Trading Below Strategy’s Realized Price is a Gift for Late-Cycle Allocators

    The Saylor Discount: Why Bitcoin Trading Below Strategy’s Realized Price is a Gift for Late-Cycle Allocators

    Bitcoin continues to struggle below the $65,000 level as persistent selling pressure weighs on market sentiment. Price action has remained fragile in recent weeks, with volatility elevated and traders showing limited conviction amid tightening liquidity conditions and broader macro uncertainty. While intermittent rebounds have occurred, they have so far failed to establish sustained upside momentum, leaving Bitcoin locked in a cautious consolidation phase below a key psychological threshold.

    A recent CryptoQuant report highlights a notable structural development involving StrategyB, formerly known as MicroStrategy. It has now been more than six years since the company began its Bitcoin accumulation strategy, targeting roughly 5% of the asset’s total supply. The initiative, driven by CEO Michael Saylor — one of Bitcoin’s most vocal long-term advocates — reflects a conviction that BTC could eventually surpass the $1 million mark over time.

    To pursue this objective, StrategyB has executed what many consider the largest dollar-cost averaging program in Bitcoin’s history, notably without selling any BTC since inception. Annual investment figures illustrate the scale of this effort: $1.1 billion in 2020, $2.57 billion in 2021, $276 million in 2022, $1.9 billion in 2023, $21.9 billion in 2024, $22.4 billion in 2025, and $4.1 billion so far in 2026.

    StrategyB’s Aggressive Bitcoin Accumulation And Market Implications

    According to the report, 2025 marked a record year for StrategyB in terms of capital deployed, with more than $22.4 billion invested into Bitcoin accumulation. The data suggests that 2026 is currently following a comparable trajectory. If this pace continues, the firm could surpass last year’s record, further consolidating its position as one of the largest institutional holders of BTC.

    Strategy USD Amount Invested | Source: CryptoQuant

    At present, Bitcoin is trading below StrategyB’s estimated realized price, which sits near $76,000. This metric reflects the company’s average acquisition cost across its holdings. StrategyB reportedly holds approximately 717,131 BTC, equivalent to around 3.4% of Bitcoin’s circulating supply. Such concentration highlights the scale of institutional participation now embedded in the market structure.

    However, the interpretation of this data requires caution. Trading below a large holder’s realized price does not automatically imply undervaluation; realized price is a cost-basis metric, not a valuation model. Market conditions, liquidity flows, and macroeconomic variables remain dominant drivers of price direction.

    Still, the broader takeaway is notable: even major institutional participants often rely on relatively simple accumulation strategies such as dollar-cost averaging. Whether that approach proves optimal in current conditions depends on individual risk tolerance, time horizon, and broader market context.

    Weekly Breakdown Below Key Moving Averages Signals Structural Weakness

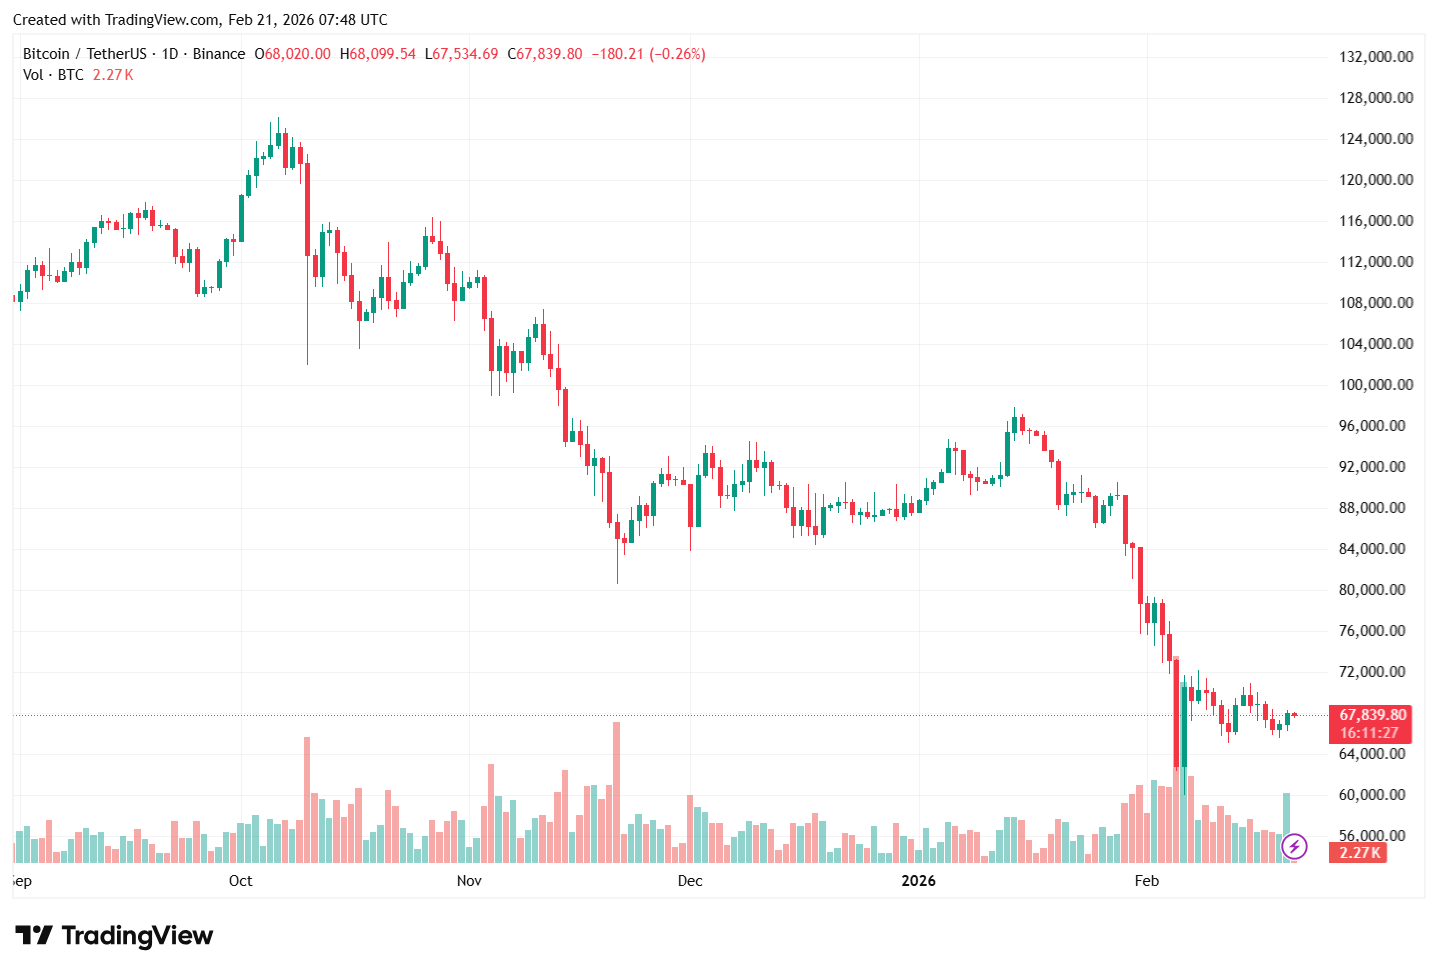
    Bitcoin’s weekly structure has deteriorated materially over the past several sessions. After failing to sustain acceptance above the $90,000–$100,000 region, price rolled over and has now retraced toward the mid-$60,000 area. The latest weekly close near $66,000 places BTC decisively below the 50-week and 100-week moving averages, both of which are beginning to slope downward.

    BTC testing critical demand level | Source: BTCUSDT chart on TradingView

    This shift in positioning is technically significant. During the 2024–2025 advance, these moving averages acted as dynamic support, consistently absorbing pullbacks and reinforcing trend continuation. Their loss now converts them into overhead resistance, limiting upside unless reclaimed with strong volume confirmation.

    The 200-week moving average, currently tracking near the mid-$50,000 zone, remains the last major structural support on this timeframe. Historically, sustained closes below the 50-week average following a cycle peak have signaled prolonged corrective phases rather than shallow consolidations.

    Volume has expanded during the recent breakdown, suggesting distribution rather than simple low-liquidity drift. The sharp selloff from the $90,000 region to sub-$70,000 levels reflects decisive supply entering the market.

    For bulls to regain control, BTC would need to reclaim the $75,000–$80,000 range and reestablish higher weekly highs. Until then, the weekly trend favors caution, with momentum tilted toward continued consolidation or further downside exploration.

    Featured image from ChatGPT, chart from TradingView.com 

  • Bitcoin Capitulation Persists As Short-Term Holders Realize $0.48B Daily Losses

    Bitcoin Capitulation Persists As Short-Term Holders Realize $0.48B Daily Losses

    On-chain data shows the Bitcoin short-term holders continue to capitulate as they are realizing net losses of $0.48 billion every day.

    Bitcoin Short-Term Holder Net Realized Profit/Loss Is Notably Red

    According to data from on-chain analytics firm Net Realized Profit/Loss has been negative for the Bitcoin short-term holders recently. This indicator measures, as its name suggests, the net amount of profit or loss that BTC investors are harvesting through their selling.

    The version of the metric that’s of relevance here specifically tracks this for the short-term holders (STHs), a BTC investor cohort that includes only buyers from the last 155 days.

    Statistically, the longer an investor holds onto their coins, the less likely they become to sell them in the future. Since the STHs represent the new entrants into the market, their resilience tends to be low, and they may take part in panic selling during market volatility.

    Recently, Bitcoin has faced a major drawdown and the STHs have naturally reacted to it. Below is the chart shared by Glassnode that shows how the 7-day exponential moving average (EMA) of the Net Realized Profit/Loss has fluctuated for this group during the recent volatility.

    Bitcoin STH Net Realized Profit/Loss

    As is visible in the graph, the Bitcoin STH Net Realized Profit/Loss saw a deep plunge into the negative territory during the price downturn that followed the October high, implying realized losses notably outweighed the profits. In January, the metric recovered toward the neutral mark as the market saw an uplift, but the price drawdown since the end of the month has again taken the indicator to a highly red level.

    On February 6th, the STH Net Realized Profit/Loss fell to a value of -$1.24 billion per day, notably lower than the red peak observed last year. Since this low, the metric has risen a bit and today, it’s sitting at -$0.48 billion per day. “While the intensity has cooled, the broader regime still signals a market under pressure, with participants in the base formation phase continuing to capitulate,” explained the analytics firm.

    In some other news, the Bitcoin Coinbase Premium Gap has been negative recently, as highlighted by CryptoQuant author IT Tech in an X post.

    Bitcoin Coinbase Premium

    The Coinbase Premium Gap tracks the difference between the Bitcoin spot price listed on Coinbase (USD pair) and that on Binance (USDT pair). From the chart, it’s apparent that the metric has maintained at red values since mid-December, indicating that Coinbase users have been applying a higher amount of selling pressure than Binance traders.

    Coinbase is mainly used by US-based investors, especially the large institutional entities, so this trend can be a sign that there isn’t much demand for BTC among them right now.

    BTC Price

    Bitcoin has been slipping deeper as its price is now trading around $64,000.

    Bitcoin Price Chart

  • Here’s What’s Driving The Bitcoin Price Crash Toward $60,0000

    Here’s What’s Driving The Bitcoin Price Crash Toward $60,0000

    In six months, the Bitcoin price has crashed by around 50%, dropping below $64,000 at the start of this month. Naturally, this has triggered a cascading event, with devastating effects on the rest of the market, and questions about what could be driving the decline. With no notable event driving the crash, as was seen in 2022 with the crash of the FTX crypto exchange, the simple answer has pointed to one thing: large investors are selling.

    Corporate Holders Are Getting Out Of Bitcoin

    In an X post, Coin Bureau highlighted an interesting trend among corporate Bitcoin holders that could explain the sustained decline the digital asset has suffered in recent times. According to the chart shared on the post, these large corporate holders have been dumping their holdings.

    For the better part of 2025, there had been a clear trend of accumulation among corporate buyers. Sometimes, the buying trend would be sustained for weeks before a sell-off trend would be recorded. However, this is quickly changing as the last few weeks have been dominated by dumping.

    The post showed that in the last three weeks, there has been no buying done. Rather, corporate investors have been dumping BTC on the market. For context, the longest selling streak among these large investors recorded in history was two weeks before buying began again.

    However, at the time of writing, only outflows have dominated the treasuries of these companies, marking a new record since companies began buying Bitcoin in 2020. Given this, it is possible that the accumulation trend that drove Bitcoin to new all-time highs in 2025 may have ended.

    Bitcoin sell-offs

    Data from CoinShares also corroborates this sell-off trend. In its Digital Asset Fund Flows Weekly Report, it shows that in just the last week alone, Bitcoin lost $215.3 million to outflows from digital asset funds, thereby leading the sell-offs.

    In the same vein, Ethereum suffered outflows of 36.5 million, and multi-asset funds saw $32.5 million in outflows. Interestingly, though, the likes of XRP and Solana continue to see inflows, despite their poor performance in the market.

    Given this trend, it shows that corporate investors are looking to altcoins for likely higher profit margins compared to Bitcoin. As supply continues to pile up in the market, it is likely that the Bitcoin price will continue to fall until buying picks up once again.

    Bitcoin price chart from Tradingview.com

  • Bithumb $43 Billion Bitcoin Blunder Triggers Political Backlash In South Korea

    Bithumb $43 Billion Bitcoin Blunder Triggers Political Backlash In South Korea

    South Korean lawmakers are ramping up pressure on financial regulators after a system failure at Bithumb, the country’s largest cryptocurrency exchange, led to the accidental distribution of more than $43 billion worth of Bitcoin (BTC) earlier this month.

    The February 6 incident has triggered political scrutiny of both the exchange itself and the agencies responsible for overseeing the virtual asset market. 

    Behind The Bithumb Massive Bitcoin Mishap

    According to local reporting by The Korea Times, members of the National Assembly are questioning how such a massive error could slip through despite repeated regulatory inspections.

    Rep. Kang Min-guk of the main opposition People Power Party disclosed that the country’s Financial Services Commission (FSC) reviewed Bithumb three times between 2022 and 2025. 

    Over the same period, the Financial Supervisory Service (FSS) conducted three separate inspections. Yet regulators failed to detect what has now been described as a critical structural weakness in the exchange’s system.

    Kang argued that existing oversight mechanisms were inadequate. He pointed out that safeguards were insufficient to prevent a situation in which a single employee could initiate massive coin transfers. Kang said:

    The episode is not merely a technical mishap but a case that lays bare deeper structural weaknesses in the virtual asset market, including complacent supervision and gaps in regulation.

    Instead of crediting users with Bitcoin worth 2,000 won — approximately $1.38 — the system mistakenly credited 2,000 Bitcoin per user. In total, 620,000 Bitcoin were incorrectly distributed. 

    Rep. Han Chang-min of the minor Social Democratic Party also criticized regulators, questioning whether supervisory authorities had meaningfully evaluated the exchange’s internal systems. “Authorities appeared to be shifting responsibility onto Bithumb despite their supervisory role,” Han said.

    Broader Crypto Oversight 

    In response to the incident, the FSS extended the deadline for its formal investigation from Feb. 13 to the end of the month, citing the need for additional time. 

    An eight-member inspection team is now intensifying its review, focusing on possible violations related to investor protection and anti-money laundering (AML) compliance. 

    Particular attention is being given to the system architecture that allowed coins not actually held by the exchange to be credited to users. Regulators have not ruled out the possibility that further erroneous distributions could be uncovered.

    Separately, financial authorities have reportedly formed an emergency response team in coordination with the Digital Asset eXchange Alliance (DAXA), a self-regulatory body representing domestic exchanges. 

    The team has begun inspections of asset verification and internal control systems at four other platforms — Upbit, Coinone, Korbit, and GOPAX. Any deficiencies are expected to be incorporated into DAXA’s self-regulatory guidelines and could influence the next phase of cryptocurrency legislation in South Korea.

    Bithumb

    At the time of writing, Bitcoin was trading at $67,763, marking a 2% decline over the past seven days and showing minimal change since Thursday’s trading session. 

    Featured image from OpenArt, chart from TradingView.com 

  • Bitcoin Extreme Fear Streak Extends To 22 Days As Price Struggles

    Bitcoin Extreme Fear Streak Extends To 22 Days As Price Struggles

    Data shows the Bitcoin Fear & Greed Index continues to be inside the extreme fear zone as the cryptocurrency market continues to struggle.

    Bitcoin Fear & Greed Index Is Still Pointing At ‘Extreme Fear’

    The “Fear & Greed Index” refers to an indicator created by Alternative that tells us about the average sentiment present among traders in the Bitcoin and wider cryptocurrency markets. The index uses the data of the following five factors to determine the market mentality: trading volume, market cap dominance, volatility, social media sentiment, and Google Trends.

    When the value of the metric is greater than 53, it means the sentiment shared by the majority of the investors is that of greed. On the other hand, the indicator being under 47 suggests the investors are fearful. Naturally, values lying between the two thresholds indicate the presence of a net neutral mentality.

    Besides these three main zones, there are also two ‘extreme’ areas called the extreme fear (25 and under) and extreme greed (above 75). Recently, the market has been inside the former of the two.

    Here is how the latest value of the Bitcoin Fear & Greed Index looks:

    Bitcoin Extreme Fear

    As is visible above, the Bitcoin Fear & Greed Index has a value of 7, which is pretty deep into the extreme fear zone. In fact, this level of despair is something that the traders have rarely held historically.

    The Fear & Greed Index has consistently been at similarly low levels during the last couple of weeks, as the below chart shows.

    Bitcoin Extreme Fear

    Overall, the indicator has been stuck inside the extreme fear territory for 22 straight days now. The recent bad market sentiment is a result of the drawdown that the Bitcoin price has faced.

    In the past, cryptocurrency markets have often tended to move in the direction that goes contrary to the expectations of the majority. The probability of a contrarian move occurring has generally been the strongest in the extreme sentiment zones as that’s where the crowd is the most sure about the market’s outcome.

    Given this, the recent extreme fear mentality could help the sector bottom out. The lowest that the metric has gone this cycle is 5, which is similar to the lowest point of the previous bear market. In that bear market, however, the market consolidated and spent more time inside the extreme fear zone even after the low in the Fear & Greed Index, before a bottom was eventually reached.

    It now remains to be seen how long Bitcoin and others will take to hit a cyclical low this time around.

    BTC Price

    Bitcoin has been unable to make much recovery since its bounce from the $60,000 level as its price continues to trade around $67,700.

    Bitcoin Price Chart

  • Bitcoin Liquidity Battles Heat Up As Demand Shows First Positive Print

    Bitcoin Liquidity Battles Heat Up As Demand Shows First Positive Print

    Bitcoin remains range-bound as liquidity clears on both sides, keeping price action indecisive. After months of weakness, demand has finally turned positive, hinting that selling is easing and structural accumulation may be returning.

    BTC Stays Range-Bound Amid Active Liquidity Clearing

    Bitcoin remains locked in a range-bound state, characterized by a lack of directional commitment. Currently, the price is actively engaged in clearing liquidity on both sides of the spread. This creates a market environment where expansion is met with selling pressure, while price dips are swiftly absorbed by buyers, trapping the asset in a tug-of-war.

    According to Columbus, market liquidity remains exceptionally well-defined both above and below the current price levels. This structure reinforces the ongoing choppy environment, as the market seems content to bounce between established pockets of orders. In such a scenario, the data suggests that patience is the most valuable asset for traders.

    Bitcoin

    From this juncture, the market’s trajectory depends on how it reacts after the nearby liquidity is purged. If Bitcoin begins to find acceptance above the current range following a liquidity sweep, the probability shifts toward a bullish expansion, triggering a move into higher upside pockets.

    Conversely, if the attempt to gain acceptance fails after a sweep, the market remains vulnerable to further downside. This could result in additional sweeping of lower liquidity levels before any sustained recovery can materialize. Until then, the prevailing goal remains a technical clean-up of liquidity before the next major trend is established.

    Bitcoin Demand Turns Positive After Months Of Weakness

    CryptosRus recently highlighted that after nearly three months of persistent weakness, Bitcoin’s apparent demand has finally turned back above zero, currently sitting around +1,200 BTC. This marks a notable shift in investors’ sentiment and action in a market struggling with heightened volatility. 

    Back in December, demand had bottomed near -154,000 BTC, a quantity that helps explain the sluggish price action that persisted in the following weeks. Since then, the pressure has been quietly easing. Selling activity is slowing, and structural accumulation is beginning to re-emerge, signaling a potential shift in market dynamics.

    It’s important to understand what this metric represents, which is whether long-term holders are absorbing new supply. When demand is deeply negative, the market tends to struggle. Conversely, when the metric turns positive, it suggests that buying activity is rebuilding, creating conditions for a healthier market structure.

    That said, the market is not out of the woods yet. A single positive print does not confirm a trend reversal. However, if this recovery in demand persists, it is often one of the earliest indicators that the market is transitioning from a distribution phase back toward accumulation, setting the stage for potential sustained strength in the weeks ahead.

    Bitcoin

  • Bitcoin Whale Profit-Taking Sees 7th Surge Since 2024 — What To Expect

    Bitcoin Whale Profit-Taking Sees 7th Surge Since 2024 — What To Expect

    As it stands, the premier cryptocurrency maintains its broader bearish structure, with its price struggling to overcome the $68,000 resistance over the past few days. However, an interesting on-chain development suggests that the Bitcoin price could likely see a relief soon, but only after a certain condition has been met. 

    Realized Profits Show Warning Pattern That Precedes Defined Moves

    In a recent Quicktake post on CryptoQuant, on-chain analyst MorenoDV revealed that Bitcoin whales have realized more than $208 million in profits. As shown by the Realized Profit By Whales metric, this event — where over $200 million is taken as profit by members of this cohort — marks the seventh such occurrence over the past two years. 

    Notably, these spikes in profits-taken have not occurred without any impact on price; instead, they have often been followed by market turbulence, which has also mostly preceded the formation of local bottoms. This suggests that large-scale selling from seasoned holders tends to introduce temporary liquidity imbalances. 

    After the supply created by these whales is absorbed, it often leads to price stabilization. Interestingly, this stability has often preceded bullish reversals in the Bitcoin price. However, there have also been a few instances where such profit-taking among this investor cohort coincided with the establishment of local tops.

    Bitcoin

    Nonetheless, MorenoDV explained that this profit-taking behavior among the Bitcoin whales typically signals conviction, due to the behavioral consistency of this investor class. As such, these large investors rarely sell impulsively, but when they do, “it signals conviction about near-term price exhaustion or strategic repositioning.”

    Hence, if history is anything to go by, the analyst explained that the Bitcoin market stands a high chance of experiencing turbulence in the near-term. However, this also comes with the inference that the Bitcoin price is closer to a local exhaustion point than to the start of a bearish market cycle.

    If institutional flows, or even mid-sized holders, begin accumulating at current levels, the market could interpret this as a healthy rotation, which could in turn translate into bullish momentum. On the other hand, if demand should remain insufficient or if more market participants sell their holdings, downside pressure could be amplified, thereby pushing prices further south.

    Bitcoin Price At A Glance

    At the time of writing, the price of BTC stands at around $67,960, reflecting no significant movement in the past 24 hours.

    Bitcoin

  • Bitcoin Market Resets With 28% Deleveraging — What Next?

    Bitcoin Market Resets With 28% Deleveraging — What Next?

    At the beginning of February, the price of Bitcoin tumbled to a new low not seen since US President Donald Trump got elected in November 2024. This downside volatility is believed to have been precipitated by the overleveraging in the BTC market at the time. According to the latest on-chain data, the Bitcoin derivatives market has witnessed a massive flush-out over the past week.

    BTC Market Now At Reduced Risk Of Liquidation Cascades 

    In a fresh Quicktake post on the CryptoQuant platform, trader CryptoOnchain revealed a dramatic flush-out in the Bitcoin derivatives market on Binance, the world’s largest crypto exchange by trading volume. The relevant indicator here is the Estimated Leverage Ratio (ELR), which has seen a significant decline in recent weeks.

    The Estimated Leverage Ratio is an on-chain metric that measures the ratio of open interest and the reserve of an exchange (Binance, in this case). This indicator tracks the average amount of leverage used by traders in a particular market or exchange. A high ELR value typically implies elevated market risk, signaling that small price movements could potentially lead to significant liquidations and further price movements.

    As reported by NewsBTC in late January, the ELR was at an extremely high level of around 0.1980, indicating an overheated and highly speculative market. Following the crash of the Bitcoin price, the on-chain metric has also cooled off, falling to around 0.1414.

    Bitcoin

    According to CryptoOnchain, this 28% decline in the Estimated Leverage Ratio highlights a shiftbin market dynamics. The market quant said that the drop in ELR suggests that a severe deleveraging event has occurred, with the accompanying price decline causing the closure of several overleveraged long positions.

    CryptoOnchain added:

    While the immediate price action was painful, wiping out excess leverage is fundamentally healthy. It removes the “derivatives bubble” and leaves the market structure much lighter and less susceptible to extreme, sudden volatility.

    The crypto analyst concluded that the risk of further liquidation cascades is reduced, now that the Estimated Leverage Ratio has fallen to normal levels. However, the Bitcoin market needs organic buying pressure and genuine demand from the spot market to rebuild a bullish structure and resume a sustainable upward trend.

    Bitcoin Price Overview

    As of this writing, the price of BTC sits around $67,950, reflecting an almost 2% jump in the past 24 hours. According to data from CoinGecko, the premier cryptocurrency is still down by more than 1% on the weekly timeframe.

    Bitcoin