Blog

  • Bitcoin Extreme Fear Streak Extends To 22 Days As Price Struggles

    Bitcoin Extreme Fear Streak Extends To 22 Days As Price Struggles

    Data shows the Bitcoin Fear & Greed Index continues to be inside the extreme fear zone as the cryptocurrency market continues to struggle.

    Bitcoin Fear & Greed Index Is Still Pointing At ‘Extreme Fear’

    The “Fear & Greed Index” refers to an indicator created by Alternative that tells us about the average sentiment present among traders in the Bitcoin and wider cryptocurrency markets. The index uses the data of the following five factors to determine the market mentality: trading volume, market cap dominance, volatility, social media sentiment, and Google Trends.

    When the value of the metric is greater than 53, it means the sentiment shared by the majority of the investors is that of greed. On the other hand, the indicator being under 47 suggests the investors are fearful. Naturally, values lying between the two thresholds indicate the presence of a net neutral mentality.

    Besides these three main zones, there are also two ‘extreme’ areas called the extreme fear (25 and under) and extreme greed (above 75). Recently, the market has been inside the former of the two.

    Here is how the latest value of the Bitcoin Fear & Greed Index looks:

    Bitcoin Extreme Fear

    As is visible above, the Bitcoin Fear & Greed Index has a value of 7, which is pretty deep into the extreme fear zone. In fact, this level of despair is something that the traders have rarely held historically.

    The Fear & Greed Index has consistently been at similarly low levels during the last couple of weeks, as the below chart shows.

    Bitcoin Extreme Fear

    Overall, the indicator has been stuck inside the extreme fear territory for 22 straight days now. The recent bad market sentiment is a result of the drawdown that the Bitcoin price has faced.

    In the past, cryptocurrency markets have often tended to move in the direction that goes contrary to the expectations of the majority. The probability of a contrarian move occurring has generally been the strongest in the extreme sentiment zones as that’s where the crowd is the most sure about the market’s outcome.

    Given this, the recent extreme fear mentality could help the sector bottom out. The lowest that the metric has gone this cycle is 5, which is similar to the lowest point of the previous bear market. In that bear market, however, the market consolidated and spent more time inside the extreme fear zone even after the low in the Fear & Greed Index, before a bottom was eventually reached.

    It now remains to be seen how long Bitcoin and others will take to hit a cyclical low this time around.
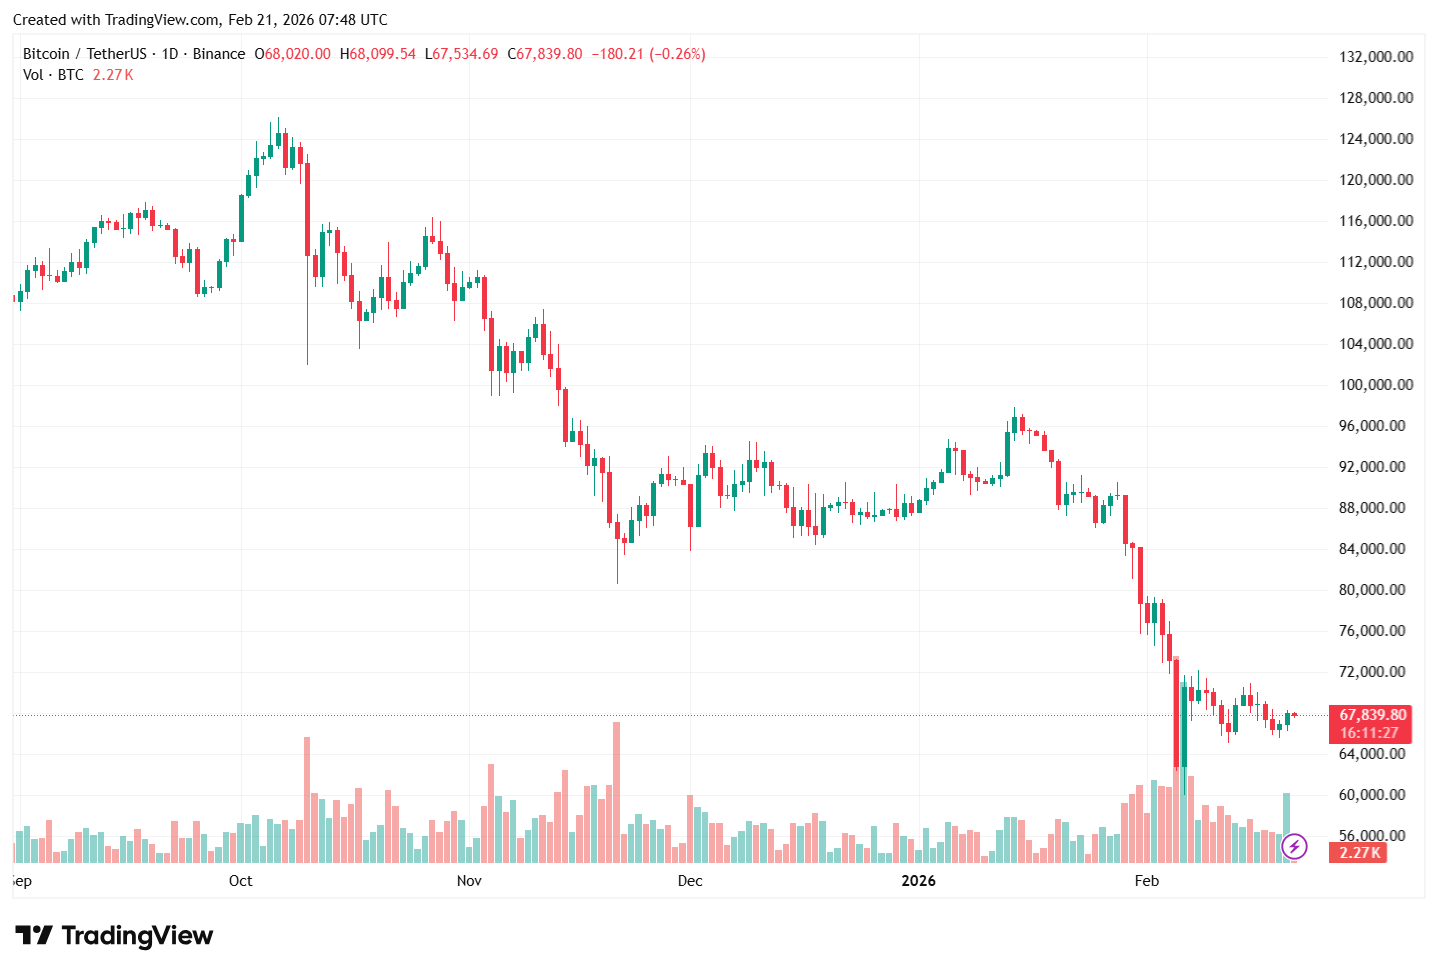
    BTC Price

    Bitcoin has been unable to make much recovery since its bounce from the $60,000 level as its price continues to trade around $67,700.

    Bitcoin Price Chart

  • Bithumb $43 Billion Bitcoin Blunder Triggers Political Backlash In South Korea

    Bithumb $43 Billion Bitcoin Blunder Triggers Political Backlash In South Korea

    South Korean lawmakers are ramping up pressure on financial regulators after a system failure at Bithumb, the country’s largest cryptocurrency exchange, led to the accidental distribution of more than $43 billion worth of Bitcoin (BTC) earlier this month.

    The February 6 incident has triggered political scrutiny of both the exchange itself and the agencies responsible for overseeing the virtual asset market. 

    Behind The Bithumb Massive Bitcoin Mishap

    According to local reporting by The Korea Times, members of the National Assembly are questioning how such a massive error could slip through despite repeated regulatory inspections.

    Rep. Kang Min-guk of the main opposition People Power Party disclosed that the country’s Financial Services Commission (FSC) reviewed Bithumb three times between 2022 and 2025. 

    Over the same period, the Financial Supervisory Service (FSS) conducted three separate inspections. Yet regulators failed to detect what has now been described as a critical structural weakness in the exchange’s system.

    Kang argued that existing oversight mechanisms were inadequate. He pointed out that safeguards were insufficient to prevent a situation in which a single employee could initiate massive coin transfers. Kang said:

    The episode is not merely a technical mishap but a case that lays bare deeper structural weaknesses in the virtual asset market, including complacent supervision and gaps in regulation.

    Instead of crediting users with Bitcoin worth 2,000 won — approximately $1.38 — the system mistakenly credited 2,000 Bitcoin per user. In total, 620,000 Bitcoin were incorrectly distributed. 

    Rep. Han Chang-min of the minor Social Democratic Party also criticized regulators, questioning whether supervisory authorities had meaningfully evaluated the exchange’s internal systems. “Authorities appeared to be shifting responsibility onto Bithumb despite their supervisory role,” Han said.

    Broader Crypto Oversight 

    In response to the incident, the FSS extended the deadline for its formal investigation from Feb. 13 to the end of the month, citing the need for additional time. 

    An eight-member inspection team is now intensifying its review, focusing on possible violations related to investor protection and anti-money laundering (AML) compliance. 

    Particular attention is being given to the system architecture that allowed coins not actually held by the exchange to be credited to users. Regulators have not ruled out the possibility that further erroneous distributions could be uncovered.

    Separately, financial authorities have reportedly formed an emergency response team in coordination with the Digital Asset eXchange Alliance (DAXA), a self-regulatory body representing domestic exchanges. 

    The team has begun inspections of asset verification and internal control systems at four other platforms — Upbit, Coinone, Korbit, and GOPAX. Any deficiencies are expected to be incorporated into DAXA’s self-regulatory guidelines and could influence the next phase of cryptocurrency legislation in South Korea.

    Bithumb

    At the time of writing, Bitcoin was trading at $67,763, marking a 2% decline over the past seven days and showing minimal change since Thursday’s trading session. 

    Featured image from OpenArt, chart from TradingView.com 

  • Saylor Makes Bold $1M Bitcoin Call — “It’s Zero Or A Million”

    Saylor Makes Bold $1M Bitcoin Call — “It’s Zero Or A Million”

    Markets are quiet and uneasy. Bitcoin prices have pulled back, and big holders are keeping a cool face while the charts wobble. Reports note that one outspoken investor frames the market in stark terms: it either fails completely or becomes far more valuable than people now imagine.

    Saylor’s Binary Bet

    According to Michael Saylor, Bitcoin has only two plausible final outcomes: worthless, or worth $1 million per coin. That is not a quick trading idea. It’s a long-running view about scarcity and demand.

    Saylor argues that a fixed supply paired with growing institutional buying and broader custody tools makes a future of massive price gains possible. He points to more banks, more spot ETFs and bigger corporate allocations as proof that demand has matured.

    A Warning From The Other Side

    Reports note that not everyone agrees. Mike McGlone of Bloomberg has sketched a darker path, one where price pressure and macro shocks could push values much lower — even toward $10,000.

    That view is rooted in history: markets can fall a long way before confidence returns. Short-term moves can be savage. Longer swings can be slower to recover. Both views are true on their own terms, because they answer different questions about time and risk.


    Balance Sheet And Funding

    Based on reports, the firm backing Saylor’s posture holds a very large stake: 717,131 BTC bought at an average cost of $76,027 a coin. That position is underwater for now. Still, financing choices matter. Strategy relies on equity, convertible notes, and preferred shares to meet cash needs.

    Arkham Intelligence has mapped out that preferred dividends are optional and redemptions are not automatic, which lowers the chance of forced sales right away. That setup buys time, though it does not erase exposure if prices stay low for a long stretch.

    Supply, Demand And The Big Numbers

    Saylor’s $1 million projection is driven by a supply argument: there are only 21 million coins. If enough institutions and treasuries keep buying, the math pushes the price up.

    He has said that with a particular share of total coins held by his firm, values could move into the millions, and he has sketched an even higher, $10 million possibility under stronger concentration scenarios.

    Those are not forecasts you can treat like short-term targets. They are conditional models — possible only if adoption, regulation and market behavior all line up for years.

    The path forward is not easy. Bitcoin could crawl higher, stumble and trade in narrow ranges for years, or shoot up as new buyers enter. Politics, regulation and global liquidity will shape which route unfolds. Institutional entry has changed the market structure, but it has not removed the risk of big drawdowns.

    Featured image from Pixabay, chart from TradingView

  • Bitcoin Trades Below ETF Cost-Basis As MVRV Signals Mounting Pressure

    Bitcoin Trades Below ETF Cost-Basis As MVRV Signals Mounting Pressure

    The middle of January marked the continuation of an already struggling price action for Bitcoin, as it took on another sharp downtrend. Early into February, the flagship cryptocurrency seemed to be on a free-fall, even breaching important psychological price levels as it crashed.

    One of these levels is the cost basis of one of Bitcoin’s most influential investor cohorts – the Bitcoin ETF investors. Data from a recent on-chain evaluation reveals that Bitcoin has since traded underneath this price, and has continued to meet investors with growing heat.

    MVRV Falls Below 1  — What This Means 

    Market analyst PelinayPA has recently taken to QuickTake to reveal that the Bitcoin price is trading below the average realized price of Bitcoin ETFs, and the possible implications of this market setup. 

    Notably, the ETF MVRV (Market Value to Realized Value) index has also slipped under the 1 mark, reinforcing the agitated situation of most ETF investors. Historically, a sustained move below an MVRV of 1 signals increasing stress conditions within the BTC market, as it reflects an overwhelming dominance of unrealized losses amid an investor group.

    According to PelinayPA, this condition may cause sell-pressure to heighten, seeing as market participants would increasingly act on their emotions when dealing in the market. As such, short-term recovery attempts are likely to be met with significant resistance (as is currently the case) until the situation sees a turnaround. This is because investors who entered at higher price levels would likely exit their positions at break-even, or even under minimal losses, to avoid deep losses.

    Bitcoin

    Because the realized price of Bitcoin ETFs is approximately $80,000, this price region could act as a strong resistance level in the event that the Bitcoin price attempts a rebound. PelinayPA clarifies that if MVRV stabilizes within the 0.8–0.9 range, it could be a sign that the current bear pressure is nearing an exhaustion point; a scenario that could precede a short-term rebound towards the realized price. 

    On the other hand, if the MVRV continues to decline (as the analyst expects), it could be problematic for the Bitcoin price. This is because ETFs would be under significant pressure, which could trigger sell-offs among this investor cohort. This would, in turn, increase downward pressure and further send prices downwards, especially in the long-term.

    Bitcoin Market Overview 

    As of this writing, Bitcoin trades for $68,000, reflecting a 1.58% growth in 24 hours, according to CoinMarketCap data. Per SoSoValue data, Bitcoin ETFs have recorded a total net outflow of about $1.08 billion in February. This is after an even more staggering net withdrawal figure of $1.61 billion in January. 

    Bitcoin

  • XRP Tipped As Central Bank Bridge Asset — Bigger Than Bitcoin?

    A seasoned investor’s bold claim about XRP has reignited a common question in crypto markets: could a token built for fast settlement ever outgrow the original store-of-value?

    According to posts on X by longtime Bitcoin backer Pumpius, if central banks adopt a single on-chain bridge, XRP could eclipse Bitcoin “by magnitude.”

    On-Chain Tension And Policy Moves

    Reports note recent market moves that have worried policy makers and traders. The trading desk at the Federal Reserve requested indicative dollar/yen quotes after a sharp move in the yen, a step that Treasury officials had asked for.

    That rare check underlines how currency volatility can push officials to consider new tools, and it has renewed talk about faster settlement rails.

    Ripple’s Timeline And Institutional Talk

    Based on reports from company briefings and executive posts, Ripple’s leadership sees 2026 as the year when larger, regulated players might put real money onto the XRP Ledger.

    Ripple President Monica Long has sketched out scenarios where banks and asset managers run production systems tied to on-chain liquidity pools. Those views have been picked up across crypto news outlets and have added fuel to bullish narratives.

    How Would A Bridge Asset Work?

    Imagine dollar and euro liquidity on a ledger, available for near-instant swaps. In practice, permissioned pools and regulated stablecoins could provide the rails while an on-chain order book or matching engine handles the trades.

    Settlement times would be measured in seconds. Audit trails would be automatic. That said, large institutions put a premium on rules and oversight; any real rollout would be gradual and cautious.


    XRP Vs. BTC: The Size Of The Gap

    Numbers matter. Bitcoin’s market cap sits comfortably in the trillions, while XRP’s market value is under $100 billion dollars, depending on which tracker you consult.

    That gap is not small. For XRP to “flip” Bitcoin at present values would require trillions more in capital moving into the token — a shift that would likely need broad institutional flows and major regulatory clarity.

    Geopolitics Adds Noise

    Geopolitical strain and trade frictions, amplified by speeches or decisions from leaders, can make markets jittery. US President Donald Trump has been named in debates over policy shifts and geopolitical risk, which in turn affect capital flows and safe-haven bids.

    When politics moves markets, technical fixes such as faster settlement can look more attractive on paper; adoption in practice is another matter.

    Featured image from Unsplash, chart from TradingView

  • Bitcoin Options Update: Market Panic Fades But Traders Remain Defensive – Details

    Bitcoin Options Update: Market Panic Fades But Traders Remain Defensive – Details

    Bearish sentiments continue to dominate the Bitcoin market as the premier cryptocurrency looks to record a fifth consecutive monthly loss. Presently, prices are consolidating beneath the $70,000 mark, as market bulls struggle to force a decisive breakout above the resistance zone. 

    Amid this choppy price action, data from the Bitcoin options market shows that traders are beginning to expect less volatility but still acknowledge the fragile nature of the market.

    Bitcoin Volatility Expectations Drop, Market Panic Fades

    In an X post on February 20, Glassnode shared its weekly Bitcoin options market update, analyzing the traders’ behavior and sentiment in relation to present market conditions. The market analytics firm reports a notable change in volatility expectations that helps to subside the presently heightened bearish sentiments.

    According to Glassnode analysts, At-the-money (ATM) implied volatility across maturities has significantly dropped to around 48%, down significantly from recent highs. Because ATM IV reflects the market’s expected move, the decline suggests traders are no longer betting on an immediate price crash.


    Bitcoin

    Notably, this shift is reinforced by moves in DVOL, an indicator for measuring aggregate implied volatility expectations. Following initial spikes during the market liquidation in late January/early February, DVOL has fallen by roughly 10 volatility points over the past two weeks, signaling that extreme hedging demand is easing out.

    In addition, the short-term volatility risk premium (VRP) has turned positive. Earlier this month, one-week VRP plunged to deeply negative levels at -45, as realized volatility far exceeded implied. Since then, implied volatility has repriced higher while realized volatility has stabilized, restoring a premium in short-dated options.

    Together, these metrics suggest that panic pricing is being reset, and expectations for outsized, volatile moves have declined.

    Bitcoin Traders Remain Alert To Downside

    Despite the cooling in volatility expectations, other metrics show that traders are maintaining a defensive market position.

    For example, the Put skew, which measures the relative demand for downside protection versus upside exposure, remains quite heightened despite moving off the extreme hedge. After bottoming near the 7 volatility points, the one-week 25-delta skew has rebounded toward 14 vol. The recovery indicates that while extreme fear has subsided, demand for downside insurance remains firm.


    Bitcoin

    The taker flow data also tells a similar story. Puts represented two-thirds of last week’s options activity, with outright put buying representing about 34% of total flow. The dominance of protective positioning suggests that market participants are not fully convinced the correction has run its course.

    In conclusion, the options market is signaling a more measured outlook, where expectations for immediate turmoil have faded, but traders are hedging to hedge against the risk of another downside.  At press time, Bitcoin trades at $67,628 following a 0.92% gain in the last 24 hours.

    More data from Glassnode also shows that Dealers are broadly short gamma across a wide price range between $70,000 and $58,000, a positioning structure that could amplify selling pressure if Bitcoin extends losses. Conversely, a large gamma concentration around $75,000 suggests positioning for a potential rebound.

    Bitcoin

  • Bitcoin Liquidity Battles Heat Up As Demand Shows First Positive Print

    Bitcoin Liquidity Battles Heat Up As Demand Shows First Positive Print

    Bitcoin remains range-bound as liquidity clears on both sides, keeping price action indecisive. After months of weakness, demand has finally turned positive, hinting that selling is easing and structural accumulation may be returning.

    BTC Stays Range-Bound Amid Active Liquidity Clearing

    Bitcoin remains locked in a range-bound state, characterized by a lack of directional commitment. Currently, the price is actively engaged in clearing liquidity on both sides of the spread. This creates a market environment where expansion is met with selling pressure, while price dips are swiftly absorbed by buyers, trapping the asset in a tug-of-war.

    According to Columbus, market liquidity remains exceptionally well-defined both above and below the current price levels. This structure reinforces the ongoing choppy environment, as the market seems content to bounce between established pockets of orders. In such a scenario, the data suggests that patience is the most valuable asset for traders.

    Bitcoin

    From this juncture, the market’s trajectory depends on how it reacts after the nearby liquidity is purged. If Bitcoin begins to find acceptance above the current range following a liquidity sweep, the probability shifts toward a bullish expansion, triggering a move into higher upside pockets.

    Conversely, if the attempt to gain acceptance fails after a sweep, the market remains vulnerable to further downside. This could result in additional sweeping of lower liquidity levels before any sustained recovery can materialize. Until then, the prevailing goal remains a technical clean-up of liquidity before the next major trend is established.

    Bitcoin Demand Turns Positive After Months Of Weakness

    CryptosRus recently highlighted that after nearly three months of persistent weakness, Bitcoin’s apparent demand has finally turned back above zero, currently sitting around +1,200 BTC. This marks a notable shift in investors’ sentiment and action in a market struggling with heightened volatility. 

    Back in December, demand had bottomed near -154,000 BTC, a quantity that helps explain the sluggish price action that persisted in the following weeks. Since then, the pressure has been quietly easing. Selling activity is slowing, and structural accumulation is beginning to re-emerge, signaling a potential shift in market dynamics.

    It’s important to understand what this metric represents, which is whether long-term holders are absorbing new supply. When demand is deeply negative, the market tends to struggle. Conversely, when the metric turns positive, it suggests that buying activity is rebuilding, creating conditions for a healthier market structure.

    That said, the market is not out of the woods yet. A single positive print does not confirm a trend reversal. However, if this recovery in demand persists, it is often one of the earliest indicators that the market is transitioning from a distribution phase back toward accumulation, setting the stage for potential sustained strength in the weeks ahead.

    Bitcoin

  • Bitcoin Whale Profit-Taking Sees 7th Surge Since 2024 — What To Expect

    Bitcoin Whale Profit-Taking Sees 7th Surge Since 2024 — What To Expect

    As it stands, the premier cryptocurrency maintains its broader bearish structure, with its price struggling to overcome the $68,000 resistance over the past few days. However, an interesting on-chain development suggests that the Bitcoin price could likely see a relief soon, but only after a certain condition has been met. 

    Realized Profits Show Warning Pattern That Precedes Defined Moves

    In a recent Quicktake post on CryptoQuant, on-chain analyst MorenoDV revealed that Bitcoin whales have realized more than $208 million in profits. As shown by the Realized Profit By Whales metric, this event — where over $200 million is taken as profit by members of this cohort — marks the seventh such occurrence over the past two years. 

    Notably, these spikes in profits-taken have not occurred without any impact on price; instead, they have often been followed by market turbulence, which has also mostly preceded the formation of local bottoms. This suggests that large-scale selling from seasoned holders tends to introduce temporary liquidity imbalances. 

    After the supply created by these whales is absorbed, it often leads to price stabilization. Interestingly, this stability has often preceded bullish reversals in the Bitcoin price. However, there have also been a few instances where such profit-taking among this investor cohort coincided with the establishment of local tops.

    Bitcoin

    Nonetheless, MorenoDV explained that this profit-taking behavior among the Bitcoin whales typically signals conviction, due to the behavioral consistency of this investor class. As such, these large investors rarely sell impulsively, but when they do, “it signals conviction about near-term price exhaustion or strategic repositioning.”

    Hence, if history is anything to go by, the analyst explained that the Bitcoin market stands a high chance of experiencing turbulence in the near-term. However, this also comes with the inference that the Bitcoin price is closer to a local exhaustion point than to the start of a bearish market cycle.

    If institutional flows, or even mid-sized holders, begin accumulating at current levels, the market could interpret this as a healthy rotation, which could in turn translate into bullish momentum. On the other hand, if demand should remain insufficient or if more market participants sell their holdings, downside pressure could be amplified, thereby pushing prices further south.

    Bitcoin Price At A Glance

    At the time of writing, the price of BTC stands at around $67,960, reflecting no significant movement in the past 24 hours.

    Bitcoin

  • Ethereum Price Looks Bullish, But Only On The Inverted Chart

    Ethereum Price Looks Bullish, But Only On The Inverted Chart

    Ethereum shows signs of strength, but the bullish picture only emerges on an inverted chart. On the standard view, the downtrend remains intact until key resistance is reclaimed, making the current optimism conditional.

    Inverted Structure Reinforces Ethereum Bearish HTF Outlook

    Presenting an inverted chart in a recent higher time frame (HTF). Mizer clarified that this doesn’t necessarily plan to hold the full position to his projected targets, as he prefers focusing on lower time frame (LTF) opportunities given the difficulty of forecasting HTF moves in the current macro environment.

    According to Mizer, Ethereum’s HTF structure remains clear: a distribution phase followed by consistent breakdowns since the $5,000 peak. A parabolic curve formed off that top is a key indicator of this pattern, noting that the price has respected it for months. Until that parabola is decisively broken and price holds above it, the broader downtrend remains intact.

    Ethereum

    Zooming into the current price action, Mizer highlighted a strong impulse move into this zone marked by a purple line. This area represents a significant support/resistance flip on the inverted chart: previously resistance, it was broken and now functions as support. Mizer is now closely watching the small blue box on the right side of the chart, which represents the current consolidation following the impulse. 

    Two Scenarios From Consolidation

    The analyst further explained that from the current consolidation zone, there are two primary scenarios unfolding: either continuation after a shallow pullback, or a brief fake breakdown followed by a swift reclaim before the next leg higher on the inverted chart, which would translate to further downside for ETH itself.

    He described the purple path on his chart as his “ideal” bullish scenario on the inverted structure, essentially tracking price as it continues to respect the long-standing parabolic curve. As long as that parabola remains intact, the broader bearish trajectory remains his base case.

    Regarding targets, he divided expectations into short- and long-term objectives. The immediate target sits around $1,700, which he views as the first logical area to take profits and monitor for a potential reaction strong enough to challenge or even break the parabolic resistance.

    The final target lies near $1,400, representing the larger extension if momentum fully plays out. However, he emphasized that the setup would be invalidated if ETH loses the key flip zone and begins accepting below it on the inverted chart, a move that would break the parabola and potentially signal a broader trend reversal.

    Ethereum

  • Bitcoin Market Resets With 28% Deleveraging — What Next?

    Bitcoin Market Resets With 28% Deleveraging — What Next?

    At the beginning of February, the price of Bitcoin tumbled to a new low not seen since US President Donald Trump got elected in November 2024. This downside volatility is believed to have been precipitated by the overleveraging in the BTC market at the time. According to the latest on-chain data, the Bitcoin derivatives market has witnessed a massive flush-out over the past week.

    BTC Market Now At Reduced Risk Of Liquidation Cascades 

    In a fresh Quicktake post on the CryptoQuant platform, trader CryptoOnchain revealed a dramatic flush-out in the Bitcoin derivatives market on Binance, the world’s largest crypto exchange by trading volume. The relevant indicator here is the Estimated Leverage Ratio (ELR), which has seen a significant decline in recent weeks.

    The Estimated Leverage Ratio is an on-chain metric that measures the ratio of open interest and the reserve of an exchange (Binance, in this case). This indicator tracks the average amount of leverage used by traders in a particular market or exchange. A high ELR value typically implies elevated market risk, signaling that small price movements could potentially lead to significant liquidations and further price movements.

    As reported by NewsBTC in late January, the ELR was at an extremely high level of around 0.1980, indicating an overheated and highly speculative market. Following the crash of the Bitcoin price, the on-chain metric has also cooled off, falling to around 0.1414.

    Bitcoin

    According to CryptoOnchain, this 28% decline in the Estimated Leverage Ratio highlights a shiftbin market dynamics. The market quant said that the drop in ELR suggests that a severe deleveraging event has occurred, with the accompanying price decline causing the closure of several overleveraged long positions.

    CryptoOnchain added:

    While the immediate price action was painful, wiping out excess leverage is fundamentally healthy. It removes the “derivatives bubble” and leaves the market structure much lighter and less susceptible to extreme, sudden volatility.

    The crypto analyst concluded that the risk of further liquidation cascades is reduced, now that the Estimated Leverage Ratio has fallen to normal levels. However, the Bitcoin market needs organic buying pressure and genuine demand from the spot market to rebuild a bullish structure and resume a sustainable upward trend.

    Bitcoin Price Overview

    As of this writing, the price of BTC sits around $67,950, reflecting an almost 2% jump in the past 24 hours. According to data from CoinGecko, the premier cryptocurrency is still down by more than 1% on the weekly timeframe.

    Bitcoin